
MSc Thesis
Measuring high-resolution surface deformation signals in Turkey using Sentinel-1 radar interferometry
Supervisors:
- Dr. Jonathan R. Weiss (NOAA) (previously at Uni-Potsdam and Uni-Leeds)
- Prof. Bodo Bookhagen (Uni-Potsdam)
Abstract: Episodic fault creep (i.e., slow, aseismic slip) is an important component of tectonic deformation. The detection of creep events has been greatly facilitated by geodetic measurements, including the role these events play in the seismic cycle. Creep can release as much energy as an earthquake and has been identified in a number of faults around the globe. One such location is the North Anatolian Fault (NAF) in Turkey. Several portions of the NAF exhibit slow-slip behavior as post-seismic slip (after an earthquake). In addition, one portion of the NAF shows a “slip-burst” pattern, meaning that a year’s worth of slip occurs in a short period of time (~1 month). Here I investigate slip-burst behavior across the Ismetpasa segment of the NAF using ~6 years of high temporal and high spatial resolution Sentinel-1 interferometric synthetic aperture radar (InSAR) data. I identify at least 3 slip-bursts that occurred in June 2016, 2017, and 2018. The duration of each burst was ~1 month. The line-of- sight (LOS) slip rate associated with these bursts is ~6 mm/yr, which satisfies yearly creep slip deficit on this segment. The effect of the bursts extends ~2250 m away from the fault. In addition to the slip burst analysis, I derived a new, high-resolution strain field for Anatolia that clearly reveals creeping portions of the NAF and potentially some previously unrecognized active faults. This study confirms that episodic creep events can be clearly identified and analyzed using Sentinel-1’s high-resolution (temporal + spatial) interferometry data. Additional noise suppression and/or longer InSAR time series will enhance future efforts aimed at achieving a more detailed understanding of Anatolian active tectonics. ⬇︎ pdf (*)
(Thesis was submitted on 24.02.2022)
(Thesis was successfully defended on 13.04.2022) 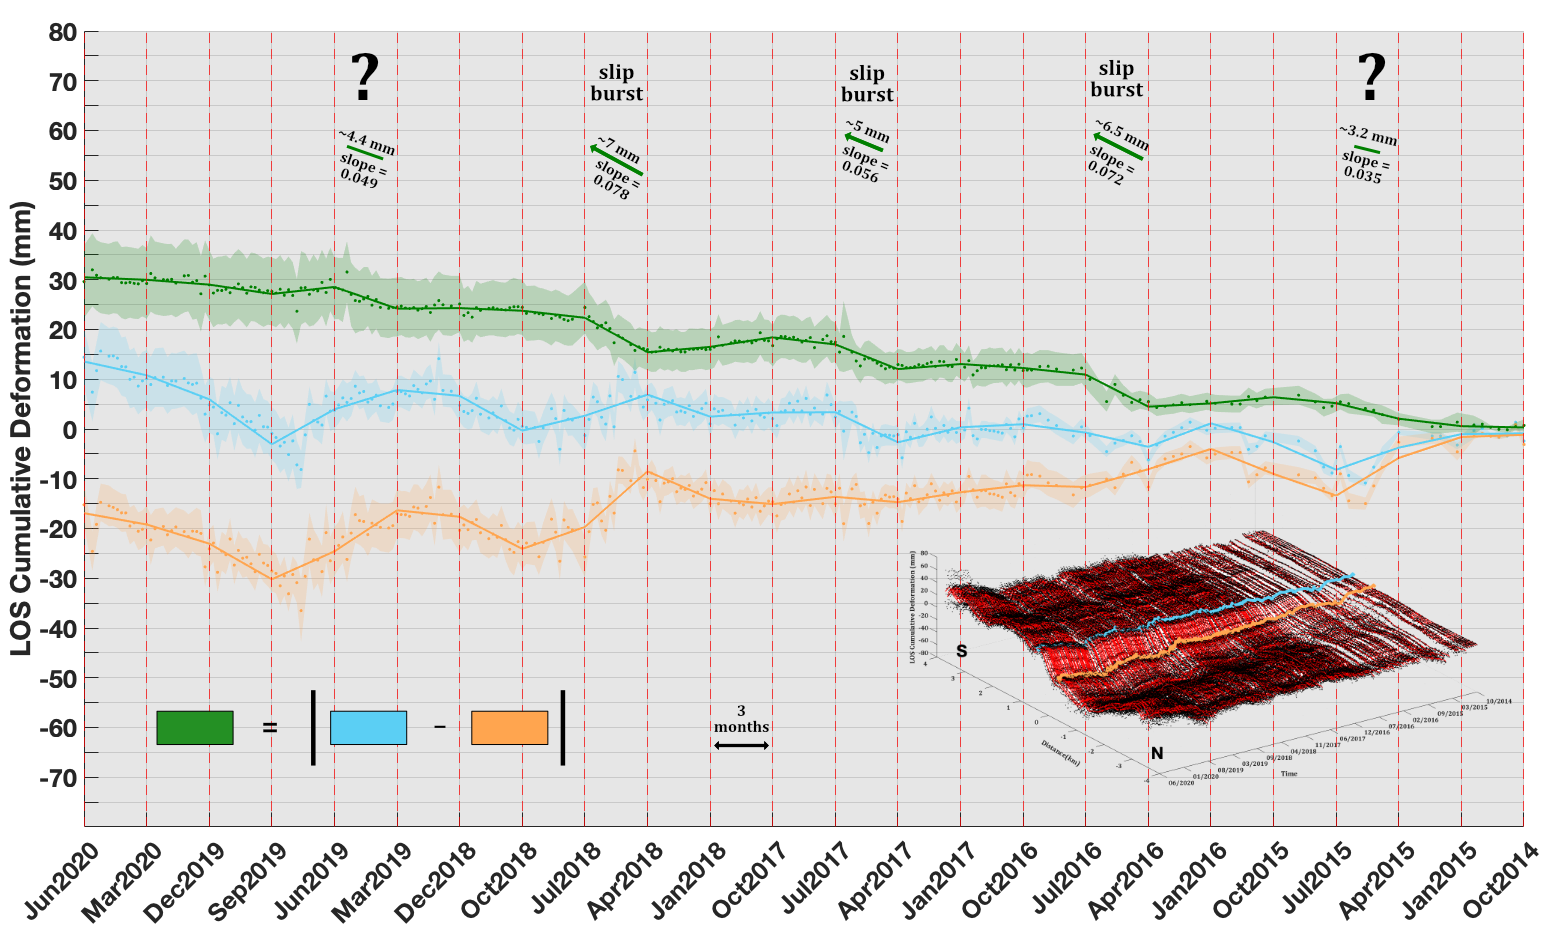 6 years evolution of a segment in North Anatolian Fault (NAF), extracted from Sentinel-1 SAR time-series. Green plot is difference between swaths centered at 300 m, taken from either side of the NAF. Five potential creep bursts are shown. Linear 3-months temporal fitting has been applied in-between red dashed lines. (Fig. 5.8 of my thesis)
*My thesis did not thoroughly peer reviewed as a journal article and is an immature work. Keep in mind that the thesis may contain errors!
*Alternative link for the thesis. ⬇︎ pdf